Business intelligence (BI) software is a collection of decision support technologies for the enterprise aimed at enabling knowledge workers such as executives, managers, and analysts to make better and faster decisions. The past two decades have seen explosive growth, both in the number of products and services offered and in the adoption of these technologies by industry. This growth has been fueled by the declining cost of acquiring and storing very large amounts of data arising from sources such as customer transactions in banking, retail as well as in e-businesses, RFID tags for inventory tracking, email, query logs for Web sites, blogs, and product reviews. Enterprises today collect data at a finer granularity, which is therefore of much larger volume. Businesses are leveraging their data asset aggressively by deploying and experimenting with more sophisticated data analysis techniques to drive business decisions and deliver new functionality such as personalized offers and services to customers. Today, it is difficult to find a successful enterprise that has not leveraged BI technology for its business. For example, BI technology is used in manufacturing for order shipment and customer support, in retail for user profiling to target grocery coupons during checkout, in financial services for claims analysis and fraud detection, in transportation for fleet management, in telecommunications for identifying reasons for customer churn, in utilities for power usage analysis, and health care for outcomes analysis.
Key Insights
- The cost of data acquisition and data storage has declined significantly. This has increased the of businesses to acquire very large volumes in order to extract as much competitive from it as possible.
- New massively parallel data architectures and analytic tools beyond parallel SQL data warehouses and OLAP engines.
- The need to shorten the time lag between data acquisition and decision making is spurring innovations in business intelligence technologies.
A typical architecture for supporting BI within an enterprise is shown in Figure 1 (the shaded boxes are technology that we focus on in this article). The data over which BI tasks are performed often comes from different sources—typically from multiple operational databases across departments within the organization, as well as external vendors. Different sources contain data of varying quality, use inconsistent representations, codes, and formats, which have to be reconciled. Thus the problems of integrating, cleansing, and standardizing data in preparation for BI tasks can be rather challenging. Efficient data loading is imperative for BI. Moreover, BI tasks usually need to be performed incrementally as new data arrives, for example, last month’s sales data. This makes efficient and scalable data loading and refresh capabilities imperative for enterprise BI. These back-end technologies for preparing the data for BI are collectively referred to as Extract-Transform-Load (ETL) tools. Increasingly there is a need to support BI tasks in near real time, that is, make business decisions based on the operational data itself. Specialized engines referred to as Complex Event Processing (CEP) engines have emerged to support such scenarios.
The data over which BI tasks are performed is typically loaded into a repository called the data warehouse that is managed by one or more data warehouse servers. A popular choice of engines for storing and querying warehouse data is relational database management systems (RDBMS). Over the past two decades, several data structures, optimizations, and query processing techniques have been developed primarily for executing complex SQL queries over large volumes of data—a key requirement for BI. An example of such an ad hoc SQL query is: find customers who have placed an order during the past quarter whose amount exceeds the average order amount by at least 50%. Large data warehouses typically deploy parallel RDBMS engines so that SQL queries can be executed over large volumes of data with low latency.
As more data is born digital, there is increasing desire to architect low-cost data platforms that can support much larger data volume than that traditionally handled by RDBMSs. This is often described as the “Big Data” challenge. Driven by this goal, engines based on the MapReduce9 paradigm—originally built for analyzing Web documents and Web search query logs—are now being targeted for enterprise analytics. Such engines are currently being extended to support complex SQL-like queries essential for traditional enterprise data warehousing scenarios.
Data warehouse servers are complemented by a set of mid-tier servers that provide specialized functionality for different BI scenarios. Online analytic processing (OLAP) servers efficiently expose the multidimensional view of data to applications or users and enable the common BI operations such as filtering, aggregation, drill-down and pivoting. In addition to traditional OLAP servers, newer “in-memory BI” engines are appearing that exploit today’s large main memory sizes to dramatically improve performance of multidimensional queries. Reporting servers enable definition, efficient execution and rendering of reports—for example, report total sales by region for this year and compare with sales from last year. The increasing availability and importance of text data such as product reviews, email, and call center transcripts for BI brings new challenges. Enterprise search engines support the keyword search paradigm over text and structured data in the warehouse (for example, find email messages, documents, history of purchases and support calls related to a particular customer), and have become a valuable tool for BI over the past decade. Data mining engines enable in-depth analysis of data that goes well beyond what is offered by OLAP or reporting servers, and provides the ability to build predictive models to help answer questions such as: which existing customers are likely to respond to my upcoming catalog mailing campaign? Text analytic engines can analyze large amounts of text data (for example, survey responses or comments from customers) and extract valuable information that would otherwise require significant manual effort, for example, which products are mentioned in the survey responses and the topics that are frequently discussed in connection with those products.
There are several popular front-end applications through which users perform BI tasks: spreadsheets, enterprise portals for searching, performance management applications that enable decision makers to track key performance indicators of the business using visual dashboards, tools that allow users to pose ad hoc queries, viewers for data mining models, and so on. Rapid, ad hoc visualization of data can enable dynamic exploration of patterns, outliers and help uncover relevant facts for BI.
In addition, there are other BI technologies (not shown in Figure 1) such as Web analytics, which enables understanding of how visitors to a company’s Web site interact with the pages; for example which landing pages are likely to encourage the visitor to make a purchase. Likewise, vertical packaged applications such as customer relationship management (CRM) are widely used. These applications often support built-in analytics, for example, a CRM application might provide functionality to segment customers into those most likely and least likely to repurchase a particular product. Another nascent but important area is mobile BI that presents opportunities for enabling novel and rich BI applications for knowledge workers on mobile devices.
In this short article, we are not able to provide comprehensive coverage of all technologies used in BI (see Chaudhuri et al.5 for additional details on some of these technologies). We therefore chose to focus on technology where research can play, or has historically played, an important role. In some instances, these technologies are mature but challenging research problems still remain—for example, data storage, OLAP servers, RDBMSs, and ETL tools. In other instances, the technology is relatively new with several open research challenges, for example, MapReduce engines, near real-time BI, enterprise search, data mining and text analytics, cloud data services.
Data Storage
Access structures. Decision support queries require operations such as filtering, join, and aggregation. To efficiently support these operations, special data structures (not typically required for OLTP queries) have been developed in RDBMSs, described here. Access structures used in specialized OLAP engines that do not use RDBMSs are discussed later.
Index structures. An index enables associative access based on values of a particular column. When a query has one or more filter conditions, the selectivities of these conditions can be exploited through index scans (for example, an index on the StoreId column can help retrieve all sales for StoreId = 23) and index intersection (when multiple conditions exist). These operations can significantly reduce, and in some cases eliminate, the need to access the base tables, for example, when the index itself contains all columns required to answer the query. Bitmap indexes support efficient index operations such as union and intersection. A bitmap index on a column uses one bit per record for each value in the domain of that column. To process a query of the form column1 = val1 AND column2 = val2 using bitmap indexes, we identify the qualifying records by taking the bitwise AND of the respective bit vectors. While such representations are very effective for low cardinality domains (for example, gender), they can also be used for higher cardinality domains using bitmap compression.
Today, it is difficult to find a successful enterprise that has not leveraged BI technology for their business.
Materialized views. Reporting queries often require summary data, for example, aggregate sales of the most recent quarter and the current fiscal year. Hence, precomputing and materializing summary data (also referred to as materialized views) can help dramatically accelerate many decision support queries. The greatest strength of a materialized view is its ability to specifically target certain queries by effectively caching their results. However this very strength also can limit its applicability, that is, for a slightly different query it may not be possible to use the materialized view to answer that query. This is in contrast to an index, which is a much more general structure, but whose impact on query performance may not be as dramatic as a materialized view. Typically, a good physical design contains a judicious mix of indexes and materialized views.
Partitioning. Data partitioning can be used to improve both performance (discussed later) and manageability. Partitioning allows tables and indexes to be divided into smaller, more manageable units. Database maintenance operations such as loading and backup can be performed on partitions rather than an entire table or index. The common types of partitioning supported today are hash and range. Hybrid schemes that first partition by range followed by hash partitioning within each range partition are also common.
Column-oriented storage. Traditional relational commercial database engines store data in a row-oriented manner, that is, the values of all columns for a given row in a table are stored contiguously. The Sybase IQ product30 pioneered the use of column-oriented storage, where all values of a particular column are stored contiguously. This approach optimizes for “read-mostly” workloads of ad hoc queries. The column-oriented representation has two advantages. First, significantly greater data compression is possible than in a row-oriented store since data values within a column are typically much more repetitive than across columns. Second, only the columns accessed in the query need to be scanned. In contrast, in a row-oriented store, it is not easy to skip columns that are not accessed in the query. Together, this can result in reduced time for scanning large tables.
Finally, we note that in the past decade, major commercial database systems have added automated physical design tools that can assist database administrators (DBAs) in choosing appropriate access structures (see Chaudhuri and Narasayya7 for an overview) based on workload information, such as queries and updates executed on the system, and constraints, for example, total storage allotted to access structures.
Data Compression can have significant benefits for large data warehouses. Compression can reduce the amount of data that needs to be scanned, and hence the I/O cost of the query. Second, since compression reduces the amount of storage required for a database, it can also lower storage and backup costs. A third benefit is that compression effectively increases the amount of data that can be cached in memory since the pages can be kept in compressed form, and decompressed only on demand. Fourth, certain common query operations (for example, equality conditions, duplicate elimination) can often be performed on the compressed data itself without having to decompress the data. Finally, compressing data that is transferred over the network effectively increases the available network bandwidth. This is important for parallel DBMSs where data must be moved across nodes. Data compression plays a key role not just in relational DBMSs, but also in other specialized engines, for example, in OLAP.
There are different compression techniques used in relational DBMSs. Null suppression leverages the fact that several commonly used data types in DBMSs are fixed length (for example, int, bigint, datetime, money), and significant compression is possible if they are treated as variable length for storage purposes. Only the non-null part of the value is stored along with the actual length of the value. Dictionary compression identifies repetitive values in the data and constructs a dictionary that maps such values to more compact representations. For example, a column that stores the shipping mode for an order may contain string values such as ‘AIR’, ‘SHIP’, ‘TRUCK’. Each value can be represented using two bits by mapping them to values 0,1,2 respectively. Finally, unlike compression schemes in row-oriented stores where each instance of a value requires an entry (potentially with fewer bits), in column-oriented stores other compression techniques such as run-length encoding (RLE) can become more effective. In RLE compression, a sequence of k instances of value v is encoded by the pair (v,k). RLE is particularly attractive when long runs of the same value occur; this can happen for columns with relatively few distinct values, or when the column values are sorted.
There are several interesting technical challenges in data compression. First, new compression techniques suitable for large data warehouses and incurring an acceptable trade-off with decompression and update costs are important. Second, even for known compression techniques important open problems remain—for example, for RLE—the choice of sort order of the table can significantly affect the amount of compression possible. Determining the best sort order to use is a non-trivial optimization problem. Finally, the decision of whether to compress access structures is workload dependent. Thus, there is a need for automated physical design tools to also recommend which access structures should be compressed and how based on workload information.
Query Processing
A popular conceptual model used for BI tasks is the multidimensional view of data, as shown in Figure 2. In a multidimensional data model, there is a set of numeric measures that are the objects of analysis. Examples of such measures are sales, budget, revenue, and inventory. Each of the numeric measures is associated with a set of dimensions, which provide the context for the measure. For example, the dimensions associated with a sale amount can be the Product, City, and the Date when the sale was made. Thus, a measure can be viewed as a value in the multidimensional space of dimensions. Each dimension is described by a set of attributes, for example, the Product dimension may consist of the following attributes: the category, industry, model number, year of its introduction. The attributes of a dimension may be related via a hierarchy of relationships. For example, a product is related to its category and the industry attributes through a hierarchical relationship (Figure 2). Another distinctive feature of the conceptual model is its stress on aggregation of measures by one or more dimensions; for example, computing and ranking the total sales by each county for each year.
OLAP Servers. Online Analytic processing (OLAP) supports operations such as filtering, aggregation, pivoting, rollup and drill-down on the multi-dimensional view of the data. OLAP servers are implemented using either a multidimensional storage engine (MOLAP); a relational DBMS engine (ROLAP) as the backend; or a hybrid combination called HOLAP.
MOLAP servers. MOLAP servers directly support the multidimensional view of data through a storage engine that uses the multidimensional array abstraction. They typically precompute large data cubes to speed up query processing. Such an approach has the advantage of excellent indexing properties and fast query response times, but provides relatively poor storage utilization, especially when the data set is sparse. To better adapt to sparse data sets, MOLAP servers identify dense and sparse regions of the data, and store/index these regions differently. For example dense sub-arrays of the cube are identified and stored in array format, whereas the sparse regions are compressed and stored separately.
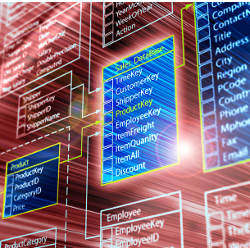
ROLAP servers. In ROLAP, the multidimensional model and its operations have to be mapped into relations and SQL queries. They rely on the data storage techniques described earlier to speed up relational query processing. ROLAP servers may also need to implement functionality not supported in SQL, for example, extended aggregate functions such as median, mode, and time window based moving average. The database designs used in ROLAP are optimized for efficiency in querying and in loading data. Most ROLAP systems use a star schema to represent the multidimensional data model. The database consists of a single fact table and a single table for each dimension. Each row in the fact table consists of a pointer (a.k.a. foreign key) to each of the dimensions that provide its multidimensional coordinates, and stores the numeric measures for those coordinates. Each dimension table consists of columns that correspond to attributes of the dimension. Star schemas do not explicitly provide support for attribute hierarchies. Snowflake schemas (shown in Figure 3) provide a refinement of star schemas where the dimensional hierarchy is explicitly represented by normalizing the dimension tables. This leads to advantages in maintaining the dimension tables.
HOLAP servers. The HOLAP architecture combines ROLAP and MOLAP by splitting storage of data in a MOLAP and a relational store. Splitting the data can be done in different ways. One method is to store the detailed data in a RDBMS as ROLAP servers do, and precomputing aggregated data in MOLAP. Another method is to store more recent data in MOLAP to provide faster access, and older data in ROLAP. Since MOLAP performs better when the data is reasonably dense and ROLAP servers perform for sparse data, Like MOLAP servers, HOLAP servers also perform density analysis to identify sparse and dense sub-regions of the multidimensional space. All major data warehouse vendors today offer OLAP servers (for example, IBM Cognos,15 Microsoft SQL,17 and Oracle Hyperion23).
In-memory BI engines. Technology trends are providing an opportunity for a new class of OLAP engines focused on exploiting large main memory to make response times for ad-hoc queries interactive. First, the ratio of time to access data on disk vs. data in memory is increasing. Second, with 64-bit operating systems becoming common, very large addressable memory sizes (for example, 1TB) are possible. Third, the cost of memory has dropped significantly, which makes servers with large amounts of main memory affordable. Unlike traditional OLAP servers, in-memory BI engines (for example, QlikView24) rely on a different set of techniques for achieving good performance. First, since the detailed data is memory resident they avoid expensive I/Os required to access data cubes, indexes, or materialized views. Second, they use data structures that would not be suitable for disk-based access, but are very effective for in-memory access. For example, consider a query that computes the total sales for each customer in a particular state. When the data is initially loaded into the system, the engine can associate pointers from each state to customers in that state, and similarly pointers from a customer to all the order detail records for that customer. This allows fast associative access required to answer the query quickly, and is reminiscent of approaches used by object-oriented databases as well as optimizations in traditional DBMSs such as join indices. Third, in-memory BI engines can significantly increase the effective data sizes over which they can operate in memory by using data organization techniques such as column-oriented storage and data compression. In-memory BI engines are best suited for read-mostly data without in-place data updates where new data arrives primarily in the form of incremental batch inserts due to data decompression cost.
Relational Servers. Relational database servers (RDBMSs) have traditionally served as the backend of large data warehouses. Such data warehouses need to be able to execute complex SQL queries as efficiently as possible against very large databases. The first key technology needed to achieve this is query optimization, which takes a complex query and compiles that query into an execution plan. To ensure that the execution plan can scale well to large databases, data partitioning and parallel query processing are leveraged extensively (see Graefe13 for an overview of query processing techniques). We therefore discuss two pieces of key technology—query optimization and parallel query processing.
Query optimization technology has been a key enabler for BI. The query optimizer is responsible for selecting an execution plan for answering a query. The execution plan is a composition of physical operators (such as Index Scan, Hash Join, Sort) that when evaluated generates the results of the query. The performance of a query crucially depends on the ability of the optimizer to choose a good plan from a very large space of alternatives. The difference in execution time between a good and bad plan for such complex queries can be several orders of magnitudes (for example, days instead of minutes). This topic has been of keen interest in database research and industry (an overview of the field appears in Chaudhuri4). Following the pioneering work done in the System R optimizer from IBM Research in the late 1970s, the next major architectural innovation came about a decade later: extensible optimizers. This allowed system designers to “plug-in” new rules and extend the capabilities of the optimizer. For example, a rule could represent equivalence in relational algebra (for example, pushing down an aggregation below join). Application of such rules can potentially transform the execution plan into one that executes much faster. Extensible optimizers allowed many important optimizations developed by industry and research over the years to be incorporated relatively easily without having to repeatedly modify the search strategy of the optimizer.
Despite the success of query optimization and the crucial role it plays in BI, many fundamental challenges still remain. The optimizer needs to address the inherently difficult problem of estimating the cost of a plan, that is, the total work (CPU, I/O, among others) done by the plan. However, constrained by the requirement to impose only a small overhead, the optimizer typically uses limited statistical information such as histograms describing a column’s data distribution. Such approximations sometimes result in brittleness since large inaccuracies can lead to generation of very poor plans. There has been research in leveraging feedback from query execution to overcome errors made by the query optimizer by observing actual query execution behavior (for example, the actual result size of a query expression), and adjusting the execution plan if needed. However, collecting and exploiting feedback at low overhead is also challenging, and much more work is needed to realize the benefits of this approach.
Parallel processing and appliances. Parallelism plays a significant role in processing queries over massive databases. Relational operators such as selection, projection, join, and aggregation present many opportunities for parallelism. The basic paradigm is data parallelism, that is, to apply relational operators in parallel on disjoint subsets of data (partitions), and then combine the results. The article by Dewitt and Gray10 provides an overview of work in this area. For several years now, all major vendors of database management systems have offered data partitioning and parallel query processing technology. There are two basic architectures for parallelism: Shared disk, where each processor has a private memory but shares disks with all other processors. Shared nothing, where each processor has private memory and disk and is typically a low-cost commodity machine. Interestingly, while these architectures date back about two decades, neither has yet emerged as a clear winner in the industry and successful implementations of both exist today.
In shared disk systems all nodes have access to the data via shared storage, so there is no need to a priori partition the data across nodes as in the shared nothing approach. During query processing, there is no need to move data across nodes. Moreover, load balancing is relatively simple since any node can service any request. However, there are a couple of issues that can affect scalability of shared disk systems. First, the nodes need to communicate in order to ensure data consistency. Typically this is implemented via a distributed lock manager, which can incur non-trivial overhead. Second, the network must support the combined I/O bandwidth of all processors, and can become a bottleneck. Shared disk systems are relatively cost effective for small- to medium-sized data warehouses.
In shared nothing systems (for example, Teradata31) data needs to be distributed across nodes a priori. They have the potential to scale to much larger data sizes than shared disk systems. However, the decision of how to effectively distribute the data across nodes is crucial for performance and scalability. This is important both from the standpoint of leveraging parallelism, but also to reduce the amount of data that needs to be transferred over the network during query processing. Two key techniques for data distribution are partitioning and cloning. For example consider a large database with the schema shown in Figure 3. Each of the two large fact tables, Orders and OrderDetails can be hash partitioned across all nodes on the OrderId attribute respectively, that is, on the attribute on which the two tables are joined. All other dimension tables, which are relatively small, could be cloned (replicated) on each node. Now consider a query that joins Customers, Orders and OrderDetails. This query can be processed by issuing one query per node, each operating on a subset of the fact data and joining with the entire dimension table. As a final step, the results of each of these queries are sent over the network to a single node that combines them to produce the final answer to the query.
Data warehouse appliances. Recently a new generation of parallel DBMSs referred to as data warehouse appliances (for example, Netezza19) have appeared. An appliance is an integrated set of server and storage hardware, operating system and DBMS software specifically pre-installed and pre-optimized for data warehousing. These appliances have gained impetus from the following trends. First, since DW appliance vendors control the full hardware/software stack, they can offer the more attractive one service call model. Second, some appliances push part of the query processing into specialized hardware thereby speeding up queries. For example, Netezza uses FPGAs (field-programmable gate arrays) to evaluate selection and projection operators on a table in the storage layer itself. For typical decision support queries this can significantly reduce the amount of data that needs to be processed in the DBMS layer.
Distributed Systems using Map-Reduce Paradigm. Large-scale data processing engines based on the Map-Reduce paradigm9 were originally developed to analyze Web documents, query logs, and click-through information for index generation and for improving Web search quality. Platforms based on a distributed file system and using the MapReduce runtime (or its variants such as Dryad16) have been successfully deployed on clusters with an order of magnitude more nodes than traditional parallel DBMSs. Also, unlike parallel DBMSs where the data must first be loaded into a table with a predefined schema before it can be queried, a MapReduce job can directly be executed on schema-less input files. Furthermore, these data platforms are able to automatically handle important issues such as data partitioning, node failures, managing the flow of data across nodes, and heterogeneity of nodes.
Data platforms based on the MapReduce paradigm and its variants have attracted strong interest in the context of the “Big Data” challenge in enterprise analytics, as described in the introduction. Another factor that makes such platforms attractive is the ability to support analytics on unstructured data such as text documents (including Web crawls), image and sensor data by enabling execution of custom Map and Reduce functions in a scalable manner. Recently, these engines have been extended to support features necessary for enterprise adoption (for example, Cloudera8). While serious enterprise adoption is still in early stages compared to mature parallel RDBMS systems, exploration using such platforms is growing rapidly, aided by the availability of the open source Hadoop14 ecosystem. Driven by the goal of improving programmer productivity while still exploiting the advantages noted here, there have been recent efforts to develop engines that can take a SQL-like query, and automatically compile it to a sequence of jobs on a MapReduce engine (for example, Thusoo et al.32). The emergence of analytic engines based on MapReduce is having an impact on parallel DBMS products and research. For example, some parallel DBMS vendors (for example, Aster Data2) allow invocation of MapReduce functions over data stored in the database as part of a SQL query. The MapReduce function appears in the query as a table that allows its results to be composed with other SQL operators in the query. Many other DBMS vendors provide utilities to move data between MapReduce-based engines and their relational data engines. A primary use of such a bridge is to ease the movement of structured data distilled from the data analysis on the MapReduce platform into the SQL system.
Near Real-Time BI. The competitive pressure of today’s businesses has led to the increased need for near real-time BI. The goal of near real-time BI (also called operational BI or just-in-time BI) is to reduce the latency between when operational data is acquired and when analysis over that data is possible. Consider an airline that tracks its most profitable customers. If a high-value customer has a lengthy delay for a fight, alerting the ground staff proactively can help the airline ensure that the customer is potentially rerouted. Such near real-time decisions can increase customer loyalty and revenue.
A class of systems that enables such real-time BI is Complex Event Processing (CEP) engines (for example, Streambase29). Businesses can specify the patterns or temporal trends that they wish to detect over streaming operational data (referred to as events), and take appropriate actions when those patterns occur. The genesis of CEP engines was in the financial domain where they were used for applications such as algorithmic stock trading, which requires detecting patterns over stock ticker data. However, they are now being used in other domains as well to make decisions in real time, for example, clickstream analysis or manufacturing process monitoring (for example, over RFID sensor data).
CEP is different from traditional BI since operational data does not need to be first loaded into a warehouse before it can be analyzed (see Figure 4). Applications define declarative queries that can contain operations over streaming data such as filtering, windowing, aggregations, unions, and joins. The arrival of events in the input stream(s) triggers processing of the query. These are referred to as “standing” or “continuous” queries since computation may be continuously performed as long as events continue to arrive in the input stream or the query is explicitly stopped. In general, there could be multiple queries defined on the same stream; thus one of the challenges for the CEP engine is to effectively share computation across queries when possible. These engines also need to handle situations where the streaming data is delayed, missing, or out-of-order, which raise both semantic as well as efficiency challenges.
There are several open technical problems in CEP; we touch upon a few of them here. One important challenge is to handle continuous queries that reference data in the database (for example, the query references a table of customers stored in the database) without affecting near real-time requirements. The problem of optimizing query plans over streaming data has several open challenges. In principle, the benefit of an improved execution plan for the query is unlimited since the query executes “forever.” This opens up the possibility of more thorough optimization than is feasible in a traditional DBMS. Moreover, the ability to observe execution of operators in the execution plan over an extended period of time can be potentially valuable in identifying suboptimal plans. Finally, the increasing importance of real-time analytics implies that many traditional data mining techniques may need to be revisited in the context of streaming data. For example, algorithms that require multiple passes over the data are no longer feasible for streaming data.
Enterprise Search
BI tasks often require searching over different types of data within the enterprise. For example, a salesperson who is preparing for a meeting with a customer would like to know relevant customer information before the meeting. This information is today siloed into different sources: CRM databases, email, documents, and spreadsheets, both in enterprise servers as well as on the user’s desktop. Increasingly, a large amount of valuable data is present in the form of text, for example, product catalogs, customer emails, annotations by sales representatives in databases, survey responses, blogs and reviews. In such scenarios, the ability to retrieve and rank the required information using the keyword search paradigm is valuable for BI. Enterprise search focuses on supporting the familiar keyword search paradigm over text repositories and structured enterprise data. These engines typically exploit structured data to enable faceted search. For example, they might enable filtering and sorting over structured attributes of documents in the search results such as authors, last modification date, document type, companies (or other entities of interest) referenced in documents. Today, a number of vendors (for example, FAST Engine Search11 and Google Search Appliance12) provide enterprise search capability.
A popular architecture for enterprise search engines is the integrated model, shown in Figure 5. The search engine crawls each data source and stores the data into a central content index using an internal representation that is suitable for fast querying. The configuration data controls what objects to index (for example, a crawl query that returns objects from a database) as well as what objects to return in response to a user query (for example, a serve query to run against the database when the query keywords match a crawled object). Several technical challenges need to be addressed by enterprise search engines. First, crawling relies on the availability of appropriate adapters for each source. Achieving a high degree of data freshness requires specialized adapters that can efficiently identify and extract data changes at the source. Second, ranking results across data sources is non-trivial since there may be no easy way to compare relevance across sources. Unlike ranking in Web search, links across documents in an enterprise are much sparser and thus not as reliable a signal. Similarly, query logs and click-through information are typically not available at sufficient scale to be useful for ranking. Finally, deploying enterprise search can involve manually tuning the relevance, for example, by adjusting the weight of each source.
Extract-Transform-Load Tools
The accuracy and timeliness of reporting, ad hoc queries, and predictive analysis depends on being able to efficiently get high-quality data into the data warehouse from operational databases and external data sources. Extract-Transform-Load (ETL) refers to a collection of tools that play a crucial role in helping discover and correct data quality issues and efficiently load large volumes of data into the warehouse.
Data quality. When data from one or more sources is loaded into the warehouse, there may be errors (for example, a data entry error may lead to a record with State = ‘California’ and Country = ‘Canada’), inconsistent representations for the same value (for example, ‘CA’, ‘California’), and missing information in the data. Therefore, tools that help detect data quality issues and restore data integrity in the warehouse can have a high payoff for BI. Data profiling tools enable identification of data quality issues by detecting violations of properties that are expected to hold in the data. For example, consider a database of customer names and addresses. In a clean database, we might expect that (Name, Address) combinations are unique. Data profiling tools verify whether this uniqueness property holds, and can quantify the degree to which it is violated, for example, this might happen if Name or Address information is missing. Data profiling tools can also discover rules or properties that hold in a given database. For example, consider an external data source that needs to be imported into a data warehouse. It is important to know which columns (or sets of columns) are keys (unique) for the source. This can help in matching the incoming data against existing data in the warehouse. For efficiency, these tools often use techniques such as sampling when profiling large databases.
Accurately extracting structure from a string can play an important role in improving data quality in the warehouse. For example, consider a shopping Web site that stores MP3 player product data with attributes such as Manufacturer, Brand, Model, Color, Storage Capacity and receives a data feed for a product as text, for example, “Coby MP3 512MB MP-C756 Blue.” Being able to robustly parse the structured information present in the text into the appropriate attributes in the data warehouse is important, for example, for answering queries on the Web site. Vendors have developed extensive sets of parsing rules for important verticals such as products and addresses. The survey article by Sarawagi28 discusses techniques to the broader area of information extraction.
Another important technology that can help improve data quality is de-duplication: identifying groups of approximately duplicate entities (for example, customers). This can be viewed as a graph clustering problem where each node is an entity and an edge exists between two nodes if the degree of similarity between two entities is sufficiently high. The function that defines the degree of similarity between two entities is typically based on string similarity functions such as edit distance (for example, ‘Robert’ and ‘Robet’ have an edit distance of as well as domain-specific rules (for example, ‘Bob’ and ‘Robert’ are synonymous). Thus, the ability to efficiently perform such approximate string matching across many pairs of entities (also known as fuzzy matching) is important for de-duplication. Most major vendors support fuzzy matching and de-duplication as part of their ETL suite of tools. An overview of tools for merging data from different sources can be found in Bernstein.3
Data load and refresh. Data load and refresh utilities are responsible for moving data from operational databases and external sources into the data warehouse quickly and with as little performance impact as possible at both ends. There are two major challenges. First, there is a need to efficiently capture data at the sources, that is, identify and collect data to be moved to the data warehouse. Triggers are general-purpose constructs supported by SQL that allow rows modified by an insert/update SQL statement to be identified. However, triggers are a relatively heavyweight mechanism and can impose non-trivial overheads on the operational database running OLTP queries. A more efficient way of capturing changed data is to sniff the transaction log of the database. The transaction log is used by the database system to record all changes so that the system can recover in case of a crash. Some utilities allow pushing filters when processing transaction log records, so that only relevant changed data is captured; for example, only changed data pertaining to a particular department within the organization.
The second aspect relates to techniques for efficiently moving captured data into the warehouse. Over the years, database engines have developed specialized, performance optimized APIs for bulk-loading data rather than using standard SQL. Partitioning the data at the warehouse helps minimize disruption of queries at the data warehouse server. The data is loaded into a partition, which is then switched in using a metadata operation only. This way, queries referencing that table are blocked only for a very short duration required for the meta-data operation rather than during the entire load time. Finally, load utilities also typically checkpoint the operation so that in case of a failure the entire work does not need to be redone. Using the techniques discussed above for capturing changed data and efficient loading, these days utilities are able to approach refresh rates in a few seconds (for example, Oracle GoldenGate22). Thus, it is potentially possible to even serve some near real-time BI scenarios, as discussed earlier.
Other BI Technology
Here, we discuss two areas we think are becoming increasingly important and where research plays a key role.
Data Mining and Text Analytics. Data mining enables in-depth analysis of data including the ability to build predictive models. The set of algorithms offered by data mining go well beyond what is offered as aggregate functions in relational DBMSs and in OLAP servers. Such analysis includes decision trees, market basket analysis, linear and logistic regression, neutral networks and more (see survey6). Traditionally, data mining technology has been packaged separately by statistical software companies, for example, SAS,26 and SPSS.27 The approach is to select a subset of data from the data warehouse, perform sophisticated data analysis on the selected subset of data to identify key statistical characteristics, and to then build predictive models. Finally, these predictive models are deployed in the operational database. For example, once a robust model to offer a room upgrade to a customer has been identified, the model (such as a decision tree) must be integrated back in the operational database to be actionable. This approach leads to several challenges: data movement from warehouse to the data mining engine, and potential performance and scalability issues at the mining engine (or implied limitations on the amount of data used to build a model). To be practical, such models need to be efficient to apply when new data arrives. Increasingly, the trend is toward “in-database analytics,” that is, integrating the data mining functionality in the backend data-warehouse architecture so that these limitations may be overcome (for example, Netz et al.20 and Oracle Data Mining21).
Text analytics. Consider a company making portable music players that conducts a survey of its products. While many survey questions are structured (for example, demographic information), other open-ended survey questions (for example, “Enter other comments here”) are often free text. Based on such survey responses, the company would like to answer questions such as: Which products are referenced in the survey responses? What topics about the product are people mentioning? In these scenarios, the challenge is to reduce the human cost of having to read through large amounts of text data such as surveys, Web documents, blogs, and social media sites in order to extract structured information necessary to answer these queries. This is the key value of text analytic engines. Today’s text analysis engines (for example, FAST11 and SAS26) primarily extract structured data that can be broadly categorized as: Named entities are references to known objects such as locations, people, products, and organizations. Concepts/topics are terms in the documents that are frequently referenced in a collection of documents. For example, in the above scenario of portable music players, terms such as “battery life,” “appearance,” and “accessories” may be important concepts/topics that appear in the survey. Such information can potentially be used as a basis for categorizing the results of the survey. Sentiment analysis produces labels such as “positive,” “neutral,” or “negative” with each text document (or part of a document such as a sentence). This analysis can help answer questions such as which product received the most negative feedback.
Cloud Data Services. Managing enterprise BI today requires handling tasks such as hardware provisioning, availability, and security patching. Cloud virtualization technology (for example, Amazon EC21) allows a server to be hosted in the cloud in a virtual machine, and enables server consolidation through better utilization of hardware resources. Hosted servers also offer the promise of reduced cost by offloading manageability tasks, and leveraging the pay-as-you-go pricing model to only pay for services that are actually used. The success of hardware virtualization in the cloud has prompted database vendors to virtualize data services so as to further improve resource utilization and reduce cost. These data services initially started as simple key-value stores but have now begun to support the functionality of a single node relational database as a hosted service (for example, Microsoft SQL Azure18). While the primary initial users of such cloud database services are relatively simple departmental applications (OLTP), the paradigm is being extended to BI as well (for example, Pentaho25).
The need for the full range of BI services over the data collected by these applications raises new challenges for cloud database services. First, the performance and scale requirements of large reporting or ad hoc queries will require database service providers to support a massively parallel processing system (parallel DBMS and/or MapReduce-based engine) in the cloud, Second, these services are multi-tenant, and complex SQL queries can be resource intensive. Thus, the ability to provide performance Service Level Agreements (SLAs) to tenants and judiciously allocate system resources across tenant queries becomes important. Third, many of the technical challenges of traditional “in-house” BI such as security and fine grained access control become amplified in the context of cloud data services. For example, techniques for processing queries on encrypted data become more important in public clouds. For these reasons, an intermediate step in adoption of BI technologies may be in private clouds, which hold promise similar to public clouds but with more control over aspects such as security.
Conclusion
The landscape of BI in research and industry is vibrant today. Data acquisition is becoming easier and large data warehouses with 10s to 100s of tera-bytes or more of relational data are becoming common. Text data is also being exploited as a valuable source for BI. Changes in the hardware technology such as decreasing cost of main memory are impacting how the backend of large data-warehouses are architected. Moreover, as cloud data services take root, more changes in the BI backend architecture are expected. Finally, there is increasing demand to deliver interactive BI experiences on mobile devices for today’s knowledge workers. There are ample opportunities to enable novel, rich, and interactive BI applications on the next generation of mobile devices. Thus, business intelligence software has many exciting technical challenges and opportunities still ahead that will continue to reshape its landscape.


Join the Discussion (0)
Become a Member or Sign In to Post a Comment