Five years ago, data artist Jer Thorp became interested in how to image the economy, and how to use models to teach people about it.
The concept of an economy is abstract and difficult even for economists to understand, says Thorp, so in 2008 he built a simple simulation to help himself and others grasp it. That worked reasonably well as a contained system, he says, “but when you do simulations, a lot of the problem is getting genuine randomness.” He thought an interesting way to achieve that would be to feed in stock market data, but he had no easy access to it; instead, he looked at the frequency of the words “red,” “green,” and “blue” in live feeds of The New York Times articles.
The project, called “The Colour Economy — The Gap Between the Rich and the Poor,” was a pivotal moment in Thorp’s career. He learned how to use The New York Times‘ Article search API and built it into a simple graphing application. Although the data he tried to import didn’t provide the results he wanted, the idea led to his Random Number Multiples page on Flickr.
“Playing around doing data visualization got a tremendous response on my blog, and that led to more experiments with other data sources,” he says. “Open data was just coming online, data source API was new, and I was in that great place — uncharted territory,” he says.
Thorp moved from Canada to New York in 2010 to become Data Artist in Residence at The New York Times. There he, along with Brian House, Jake Porway, and Matt Boggie, all members of the Times Research and Development Lab, built Open Paths, a community project that arose from after-hours discussions about iPhone data and data ownership. Open Paths is “a model for personal engagement with data” that lets people track their locations and visualize where they’ve been. Individuals can upload their data to the OpenPaths website and contribute it to research on problems like disaster preparedness, traffic flow, urban planning, and disease transmission.
Thorp also worked on an algorithm that enabled the designers to lay out the names on the 9/11 Memorial in New York City in a unique way: instead of alphabetically listing names, Thorp’s program placed them according to “meaningful adjacencies,” connections “that would reflect friendships, family bonds, and acts of heroism,” including where people were located and who they were with when they died.
Other works are based on characters and covers from The Avengers comic books (Thorp is a fan). With data from Comic Vine API, Thorp created striking visualizations of the series’ 570 issues and 132 characters. An example is included below.
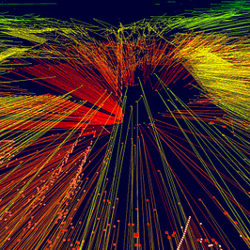
In 2011, Thorp released a video visualization of the 1,236 exoplanets identified by Kepler, the NASA space observatory launched in 2009 to discover Earth-size planets in our region of the Milky Way galaxy.
“I’ve been looking for a term to describe what I do,” he says, offering, “it’s question farming. One project raises five more questions. Then I do another project to answer those questions and then that brings more questions. Projects lead me from place to place to place, which I think is really exciting.”
To execute his projects, Thorp, now 38, eschews off-the-shelf software for an open source programming language and development environment called Processing.org, which originated in the Massachusetts Institute of Technology’s Media Lab in 2001. Thorp writes almost everything from scratch, for two reasons: “I’m stubborn,” he says, “and I like to think about how to tailor a visualization specifically to a data set. Sometimes that works and sometimes it doesn’t.” While the advantage of ready-made tools is that you can use them for any data set, Thorp argues that, barring specific circumstances, he can never visualize those data sets as thoroughly as he wants.
The Kepler dataset is a case in point. Its photometer monitors and transmits the brightness of 145,000 stars that occasionally dim as planets pass them. “An off-the-shelf data product could show you that data,” says Thorp, “but there is no setting that says, ‘take all these data points and make them orbit a single sun.’ It’s probably the only data set that involves planets orbiting suns. You can’t expect an off-the-shelf to give you that object. It would have to have a drop-down menu 40 miles long for all the possible options.” Thorp created his visualization over a weekend for fun, and NASA put it on its website.
|
|
Although his code is project-specific, Thorp does re-use pieces of it. “You can pick them up like Legos,” he says. “I often rewrite them, not because I don’t have them in modular (form), or ready, but because rewriting allows me to improve them in small ways over time. It’s also a kind of warm-up, like building a foundation, and it gets the brain going.
“Sometimes we forget that programming is a human and physical process,” he muses.
Thorp started out studying the most fundamental of human physical processes — cell biology and genetics — at the University of British Columbia, but left during his fourth year. In 1999, he joined a dotcom company as a Flash programmer. By 2002, his interests turned to abstract thinking and visualizing data, so he freelanced as a web developer. During the next decade, he worked as a “software artist, meaning an artist who uses software as the main medium.”
He names Lillian F. Schwartz, octogenarian pioneer in computer-generated art and computer-aided art analysis, and computational artists Casey Reas and Ben Fry, who co-founded Processing.org, as key influencers. (Reas is a professor in the University of California at Los Angeles’s Design Media Arts department. Fry is a principal with Fathom, a design and software consultancy in Boston, Mass.)
Thorp says what those key influencers have in common is that while their work uses technology, “they are not obsessed with technology. One thing I’ve learned is the ability and necessity to look at outside influences to inspire the work.”
That is the modus operandi of The Office for Creative Research, the startup Thorp co-founded last fall with Mark Hanson and Ben Rubin, whom he met at the Times. The company’s mission: to offer “new modes of engagement with data” and to explore “the border between data, technology, and culture.” Thorp says he, Hanson, and Rubin all have had “strongly research-based practices, so we tend to obsess over the topic (of the project), and we’re interested in drawing from different sources to try to influence the way work is done.” Their conversations are about literature, philosophy, or the history of science, and rarely about technology. “These different fields inspire how we think about our projects, which I think is the most fun.” Thorp says.
For Thorp, now a member of the World Economic Forum’s Global Agenda Council on Design Innovation and an adjunct professor in New York University’s Interactive Telecommunications Program, data visualization can be both revelatory and reductionist. “Usually when we think about the purpose of data visualization, it is to make something very complicated, simple,” he says, “I can do it to answer a question, but I’m more interested in seeing things we’ve never been able to see before. That’s where revelation comes in. How can data visualization be revelatory?
“Whereas a reductionist approach might be: ‘let’s take these 10 million data points and bake them down to a single graphic,’ I’m more interested in seeing those 10 million data points. Maybe then, we’ll be able to see a structure we haven’t noticed before.”
Karen A. Frenkel writes about science and technology and lives in New York City.


Join the Discussion (0)
Become a Member or Sign In to Post a Comment